
Subgrid Module
The subgrid module can be used to simulate wave interactions with porous constructures, rocky shorelines, and bathymetry/topography with a resolution higher than the model grid.
Theory
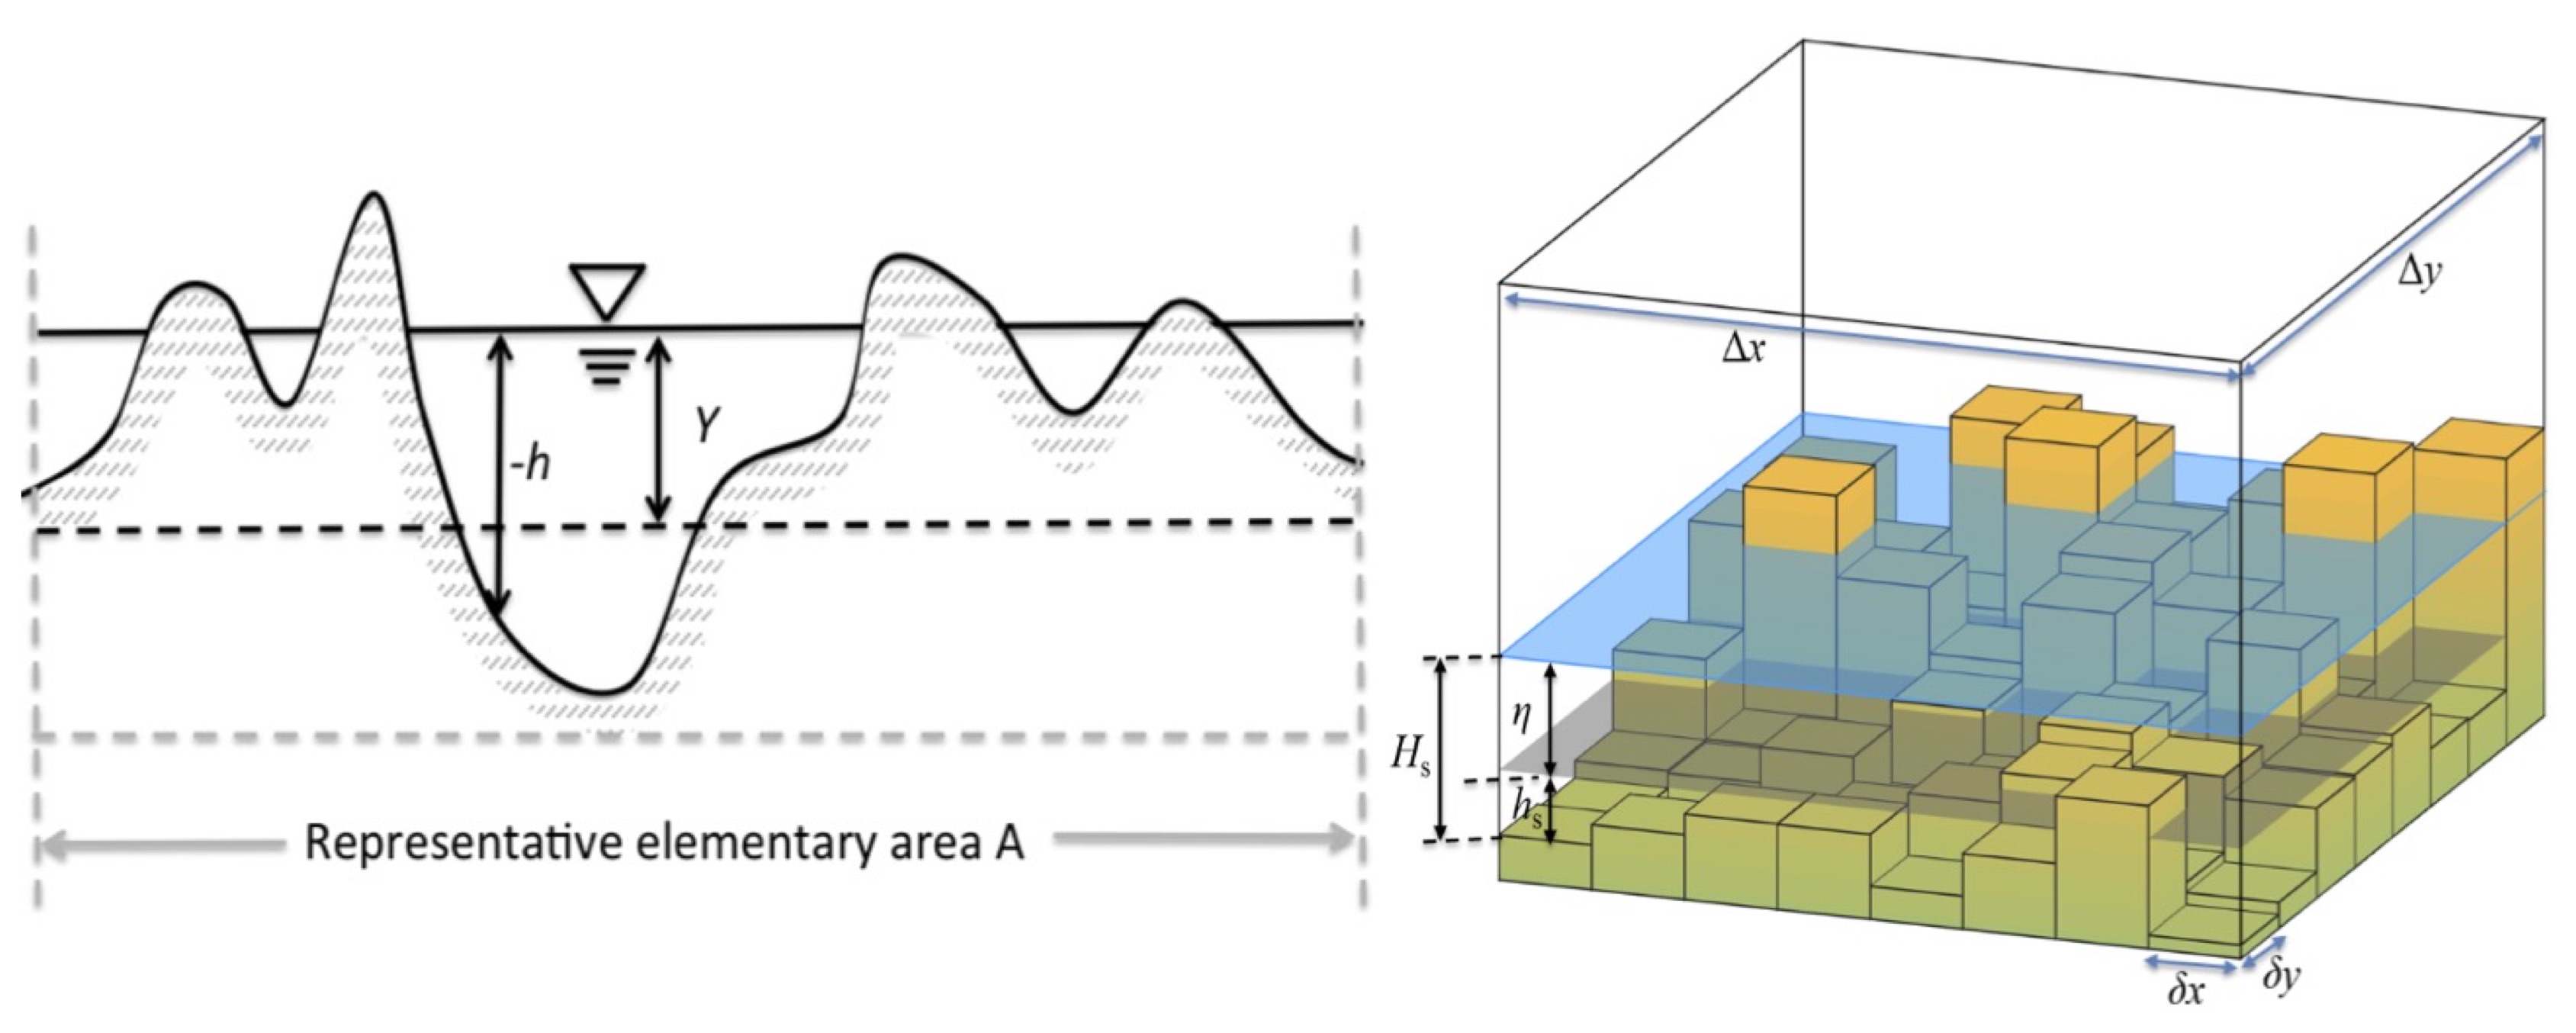
The phase-averaged (space-averaged) equations are used. The figure below shows cartoons of the subgrid strategy used in the NearCoM model. The theory will be documented later.
Subgrid configuration
To set up a higher-resolution subgrid system, a user should provide a file with data at the subgrid level. To avoid a large space and memory requirement, only grid points with available subgrid data are provided in the file. For example, you have a computational grid of 200 x 100 with grid sizes of 2m x 2m. A higher resolution data with 0.5m x 0.5m are available at grid points (150,50) and (150,51). The subgrid ratio is 4 (2/0.5). The subgrid file should contain the grid point numbers followed by 16 (4x4) bathy/topo data with the higher resolution of 0.5m x 0.5m. In this example, two lines (for the two grid points) of data should be provided:
150 50 8.5 7.5 5.5 -1.2 -2.2 0.0 1.5 3.8 8.5 7.5 5.5 -1.2 -2.2 0.0 1.5 3.8
150 51 9.1 7.2 5.1 -1.0 -2.0 0.5 1.4 3.1 8.0 7.1 5.1 -1.1 -2.9 0.2 1.1 4.9
In each line, the first two numbers are numbers of a grid point. The following numbers are 16 float numbers of the higher resolution data.
Model setup
The following statements should be included in input.txt. For example
DEPTH_FILE = depthe_200x100.txt
SubMainGridRatio = 4
DEPTH_SUBGRID_FILE = dep_sub_info.txt
DEPTH_FILE defines the regular grid as for the regular model and DEPTH_SUBGRID_FILE contains the subgrid data. SubMainGridRatio is the subgrid ratio.
Note
The code should be compiled with the option -DSUBGRID before execute
Example
In the following example, the regular computational grid has dimensions of 500 x 30 with grid sizes of 2m x 2m as shown in the figure below. The bathymetry is a plane beach with a 10m flat bottom at the wave generation region and a slope of 0.025 starting from x = 560m. Block structures (next figure below) are configured in the shallow water region from x = 800 m to the end of the domain. The data for block structures have a resolution of 0.5 m (subgrid ratio = 4).
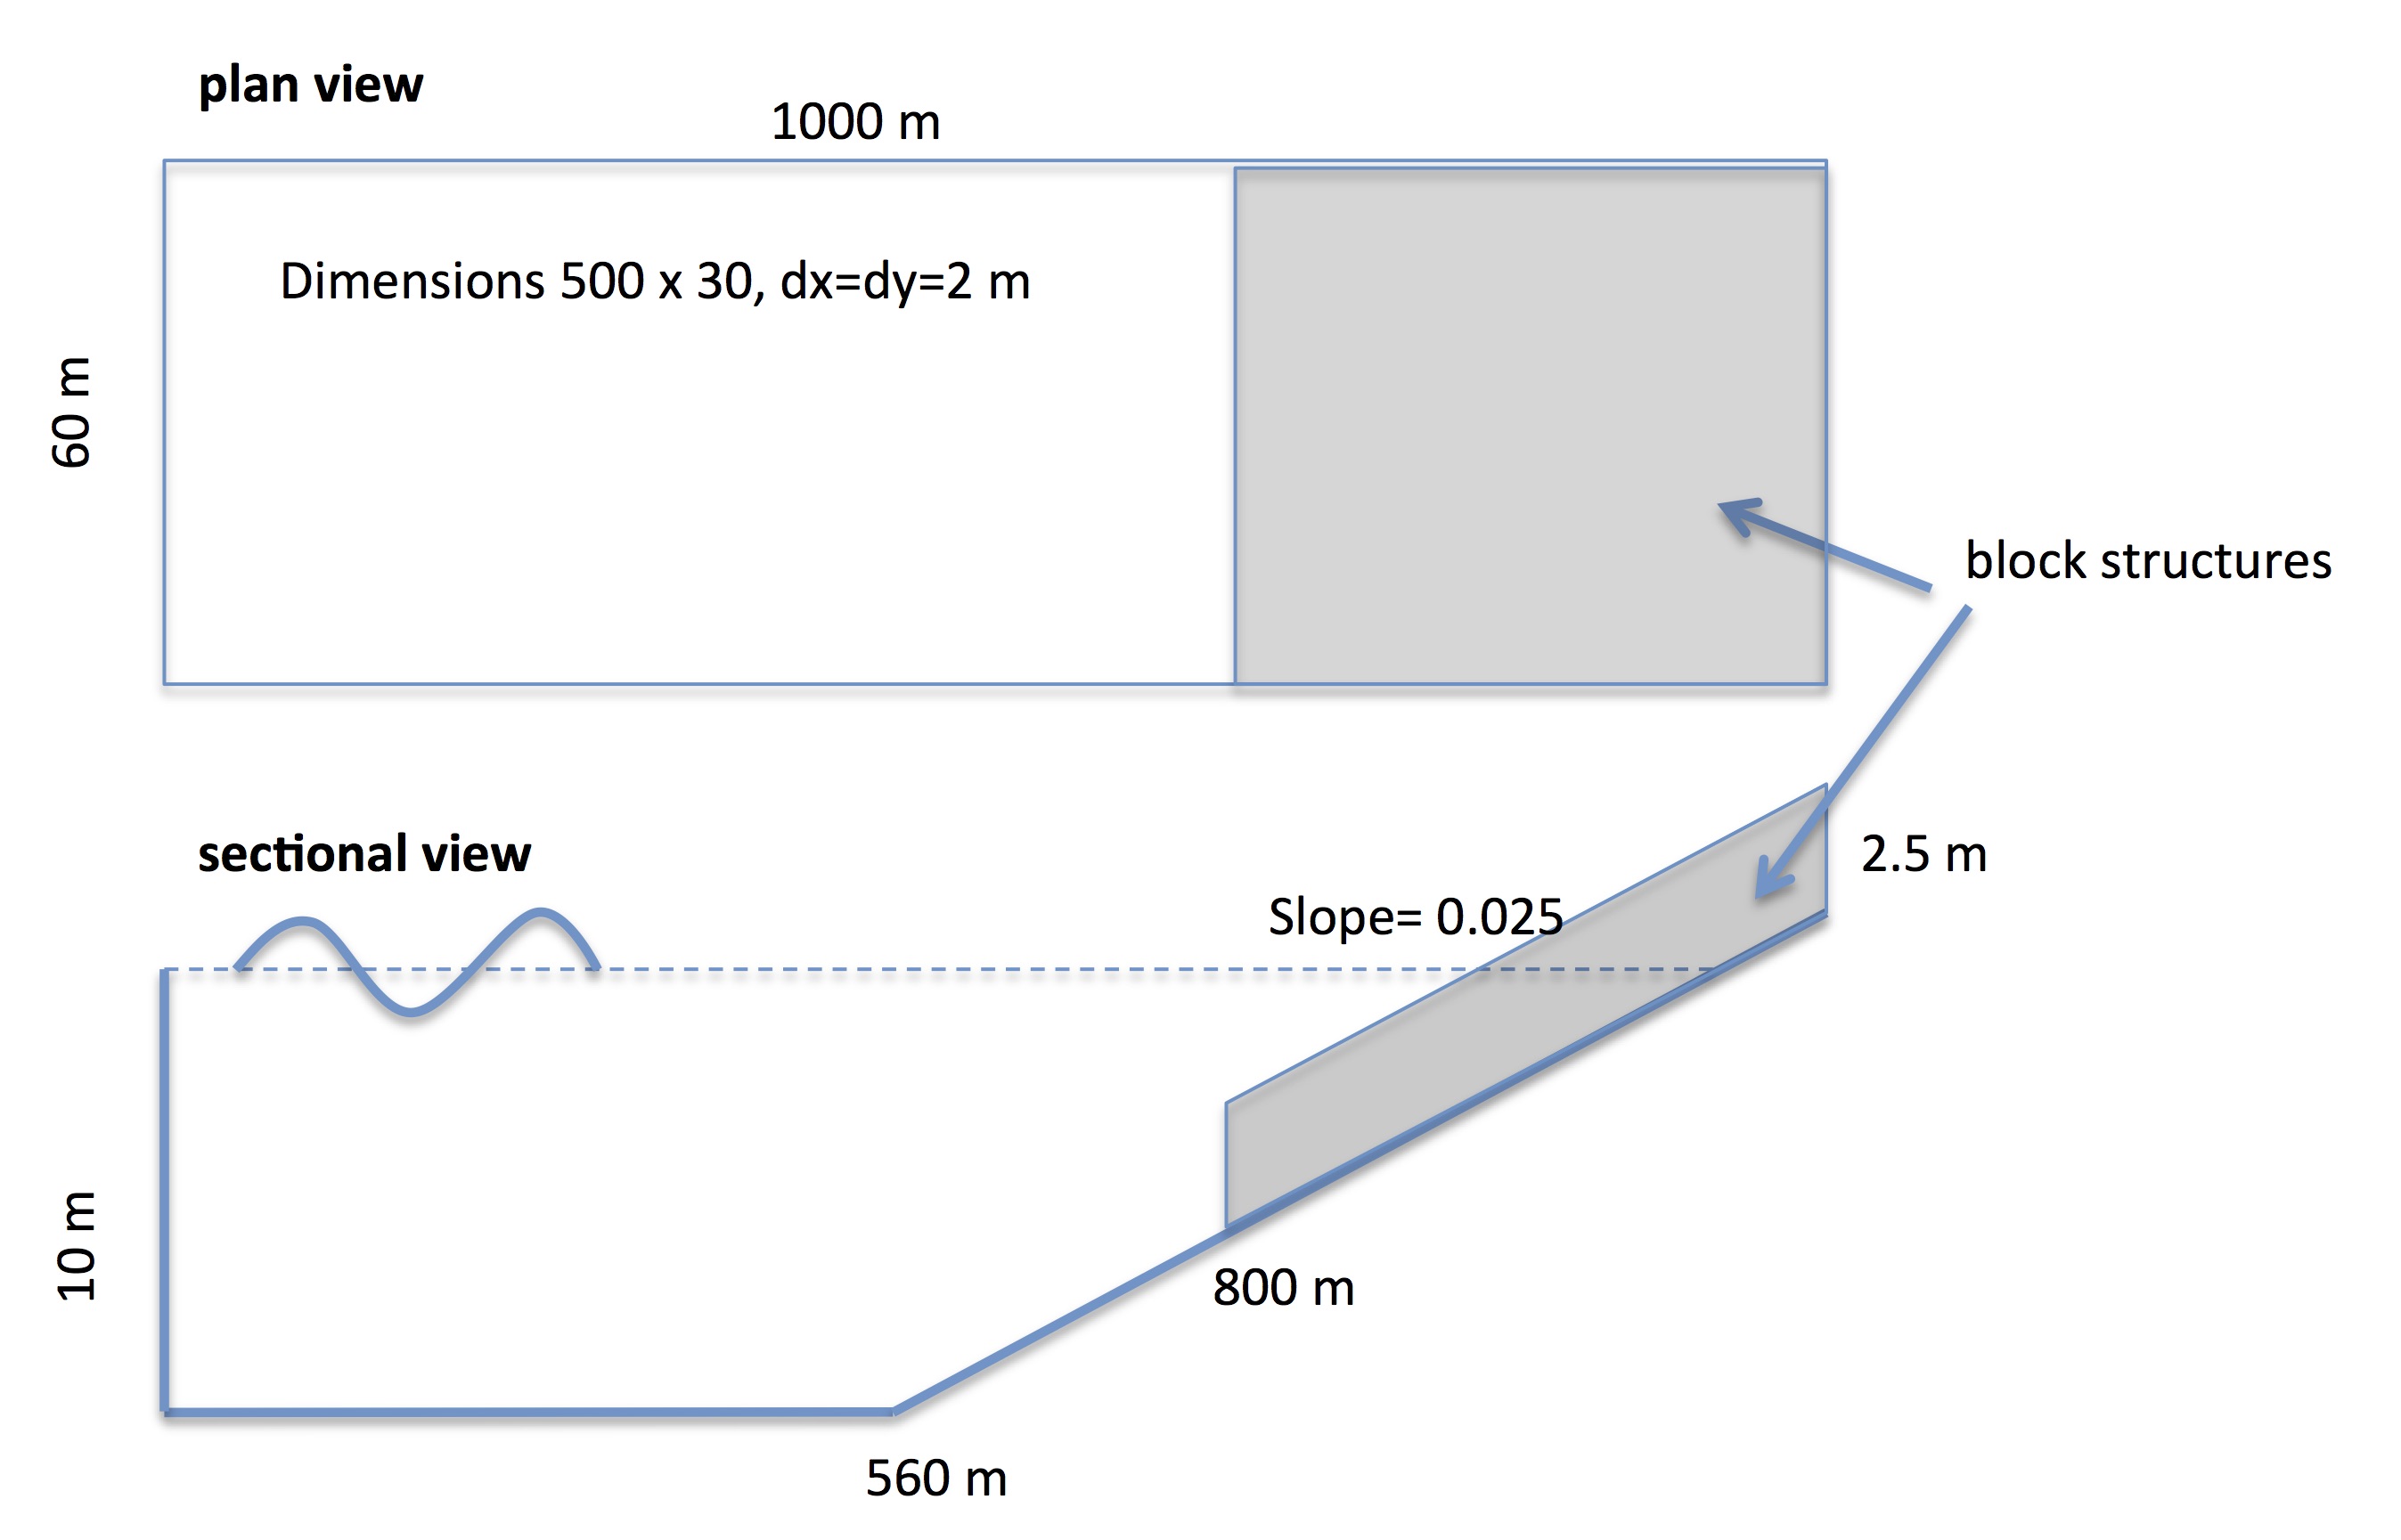
Fig. 6 The layout of the computational domain.
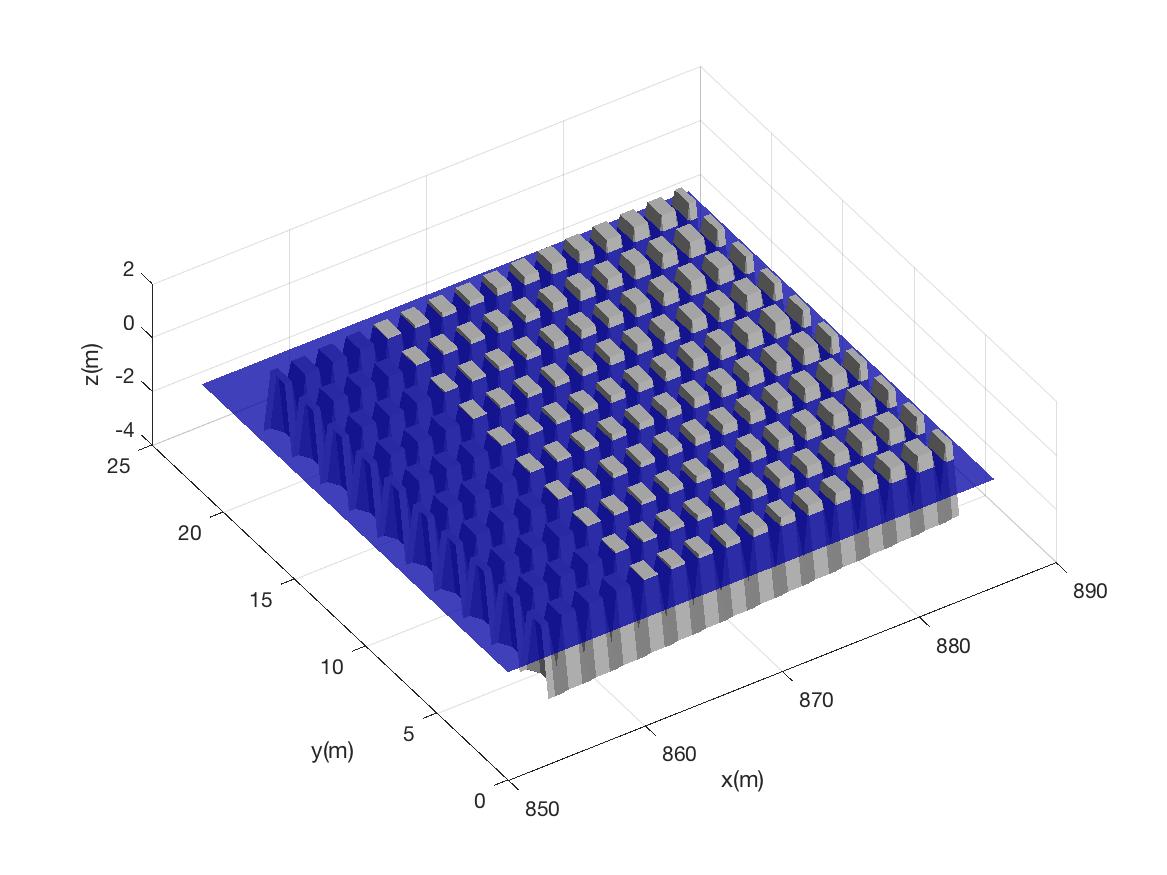
Fig. 7 Block structures superimposed on the plane beach
The figure compares of wave surface and wave setup between models with and without block structures.
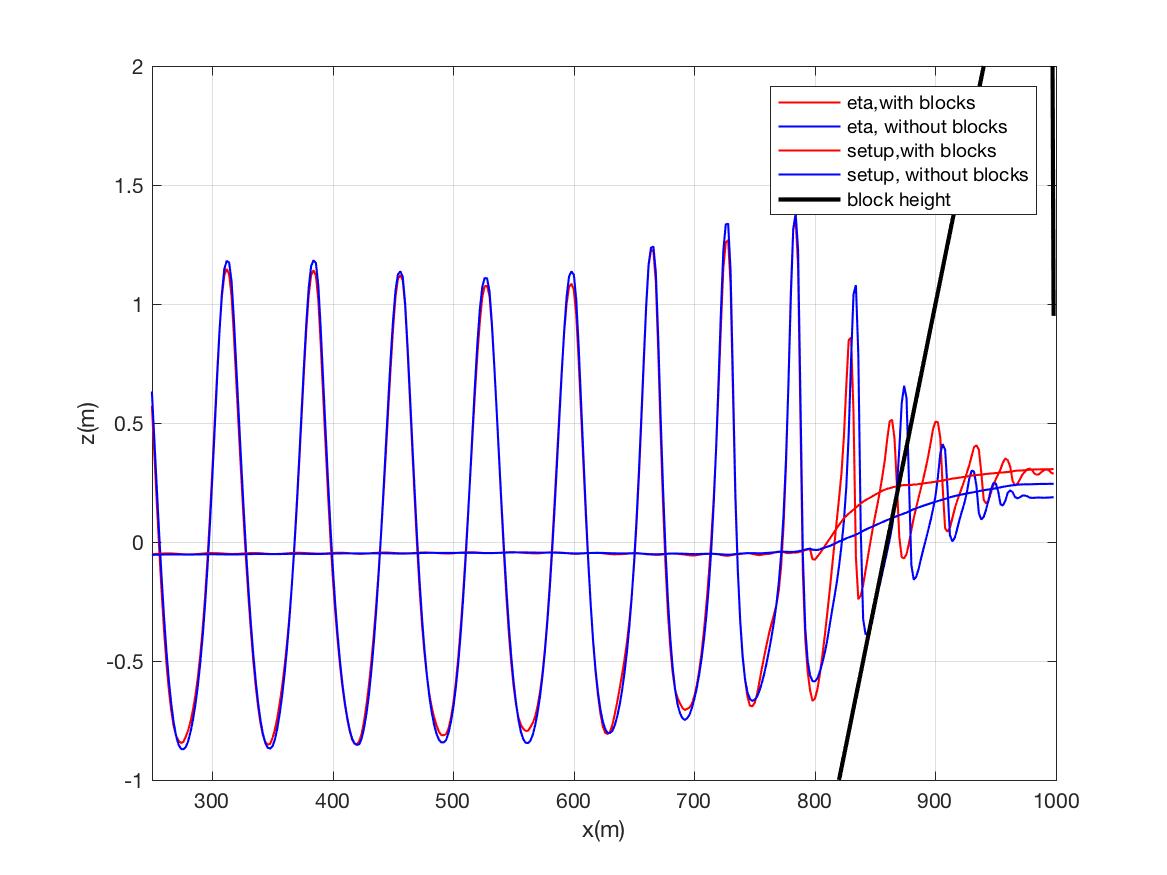
Fig. 8 Comparations of wave surface and wave setup between models with and without block structures.
More information
List of parameters for subgrid module setup can be found here