Example of IG wave generation from measured data
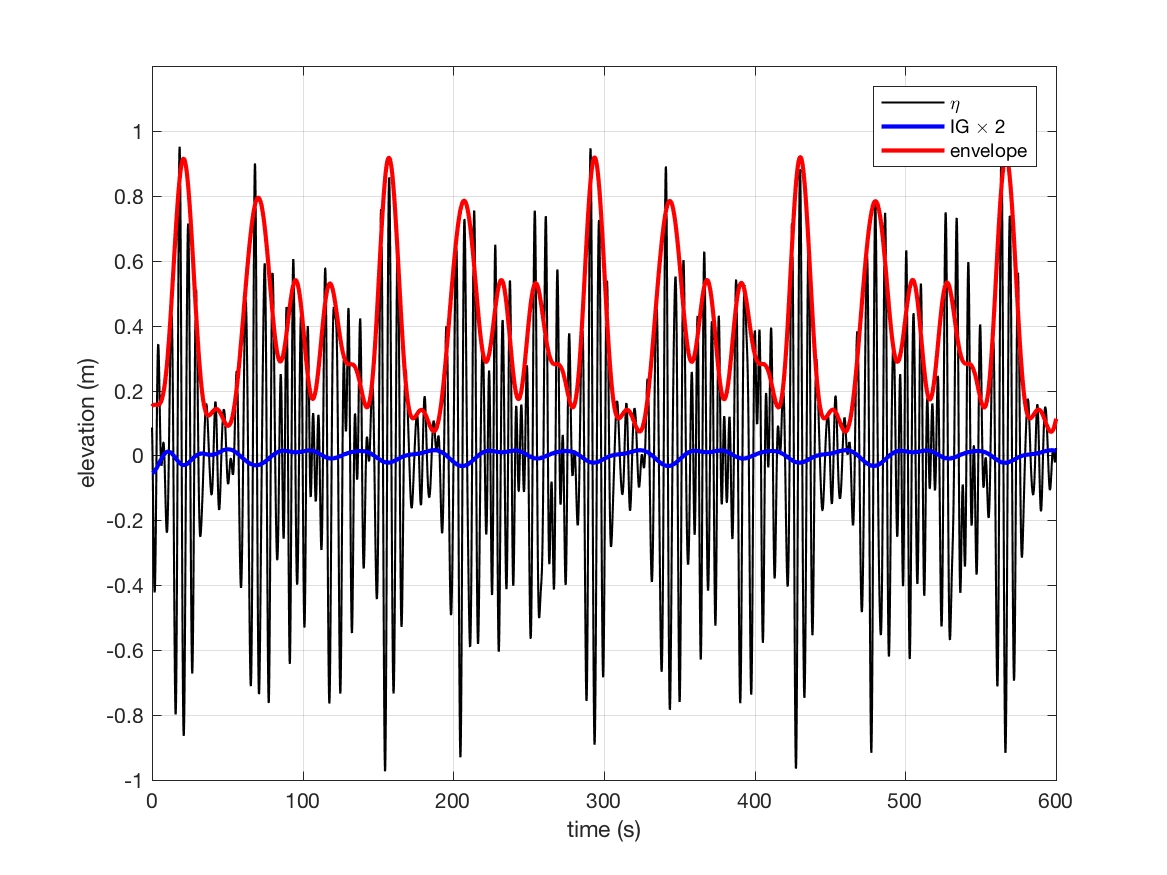
Fig. 9 Note, IG component is multiplied by 2 to show its correlation with groups
Run matlab script, Step_1_read_write_spec.m
input file: input_data_case1.txt
output files:
SPC_dep_pf.txt: contains depth and peak frequency
SPC_frq.txt: contains frequency components
SPC_angle.txt: contains wave angle (single angle)
SPC_HMO.txt: contains Hmo of wave components (note: not amplitude)
Run matlab script Step_2_IG_wave.m
output file: spectrum_random_phase.txt which will be used in input.txt. The “random phase” here means random phases are used in windwave components. The phases for IG components are calculated using Hasselmann (1962).
Modify input.txt
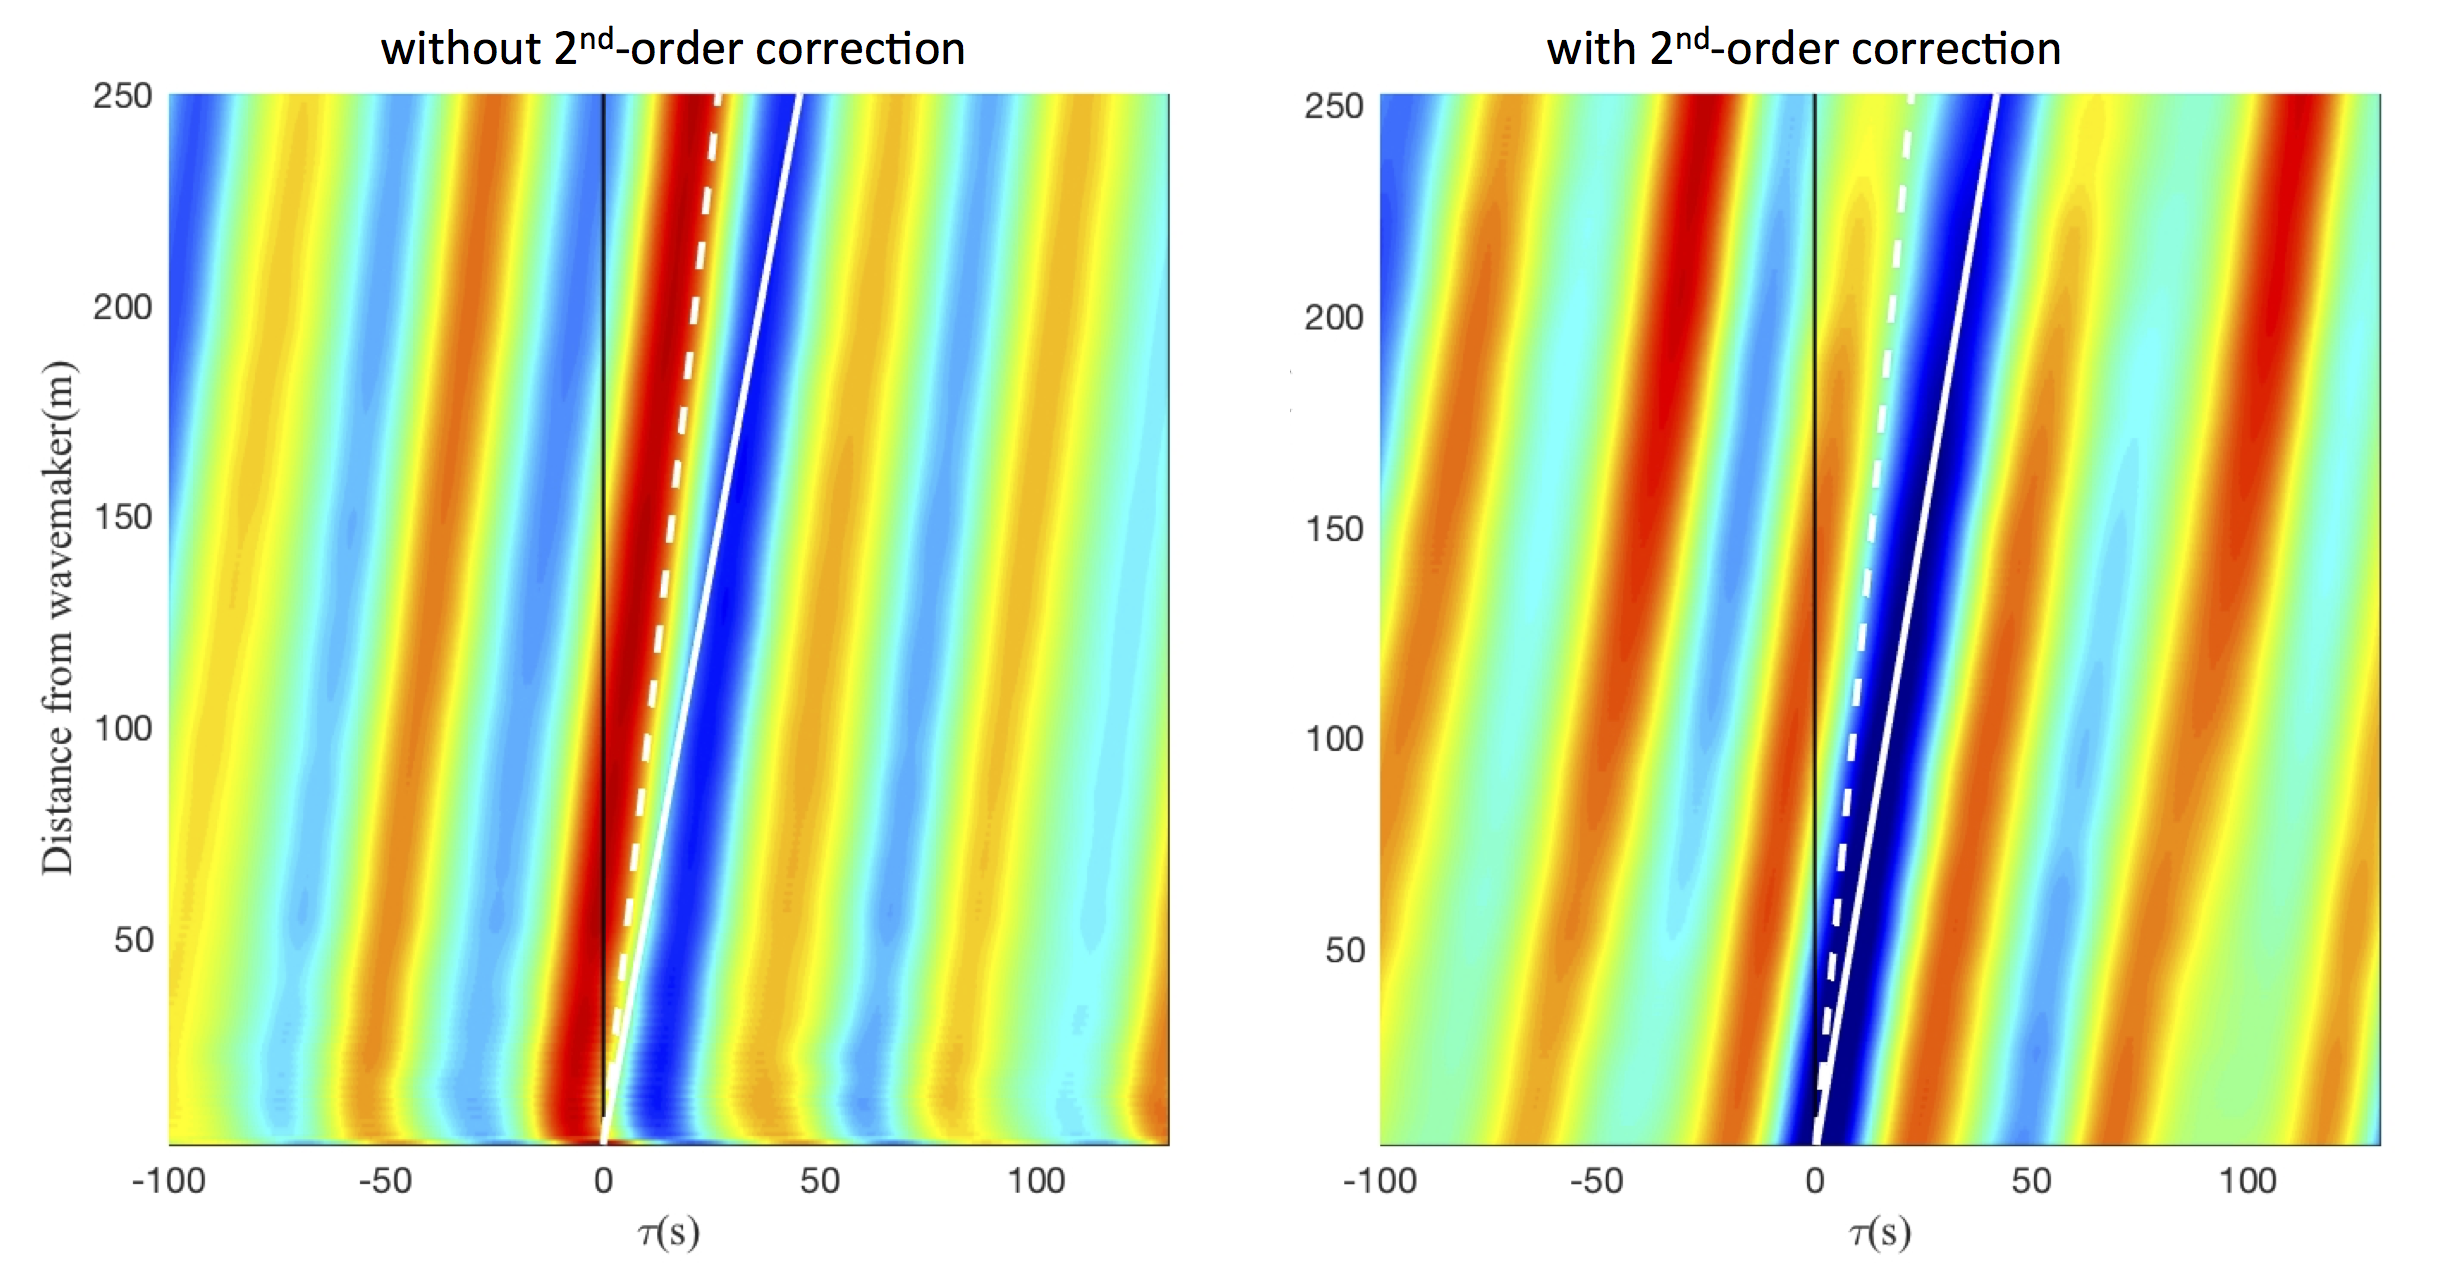
WAVEMAKER = LEFT_BC_IRR
WAVE_DATA_TYPE=DATA
WaveCompFile = spectrum_random_phase.tx
DEP_WK = 13.0
The following figure shows the correction between wave envelope and IG wave without (left) and with (right) the 2nd-order correction.